Google Analytics is the backbone of data-driven marketing. From small businesses to global enterprises, it empowers marketers with valuable insights into website performance, audience behavior, and campaign efficacy. But translating raw data into actionable marketing strategies can be daunting. This guide explores how to use Google Analytics effectively, breaking it down step-by-step to help you refine your marketing efforts and drive measurable success.
Setting Up Google Analytics for Marketing Needs
Before you can benefit from Google Analytics, it’s crucial to set it up properly. Here’s a quick, step-by-step guide to get you started.
-
Create a Google Analytics Account
Head to Google Analytics and log in with your Google account. Click “Start Measuring,” and fill out your account setup details, including a property name (often your website’s name) and time zone. -
Install the Tracking Code
After creating a property, Google Analytics provides a tracking code. Add this code to the<head>section of every page on your website so it can collect visitor data. If you’re using platforms like WordPress or Shopify, plugins like Google Site Kit can streamline this process. -
Configure Your Goals
Set goals to track key user actions like purchases, form submissions, or newsletter sign-ups. Navigate to “Admin” > “Goals,” and define custom actions that align with your marketing objectives. -
Integrate Other Tools
For deeper insights, connect Google Analytics with Google Ads, Search Console, or CRM platforms. This integration allows you to track paid campaigns, organic search performance, and customer data in one place. Read more about this topic: How to Download the Google Analytics Code in Minutes
Understanding Key Metrics in Google Analytics
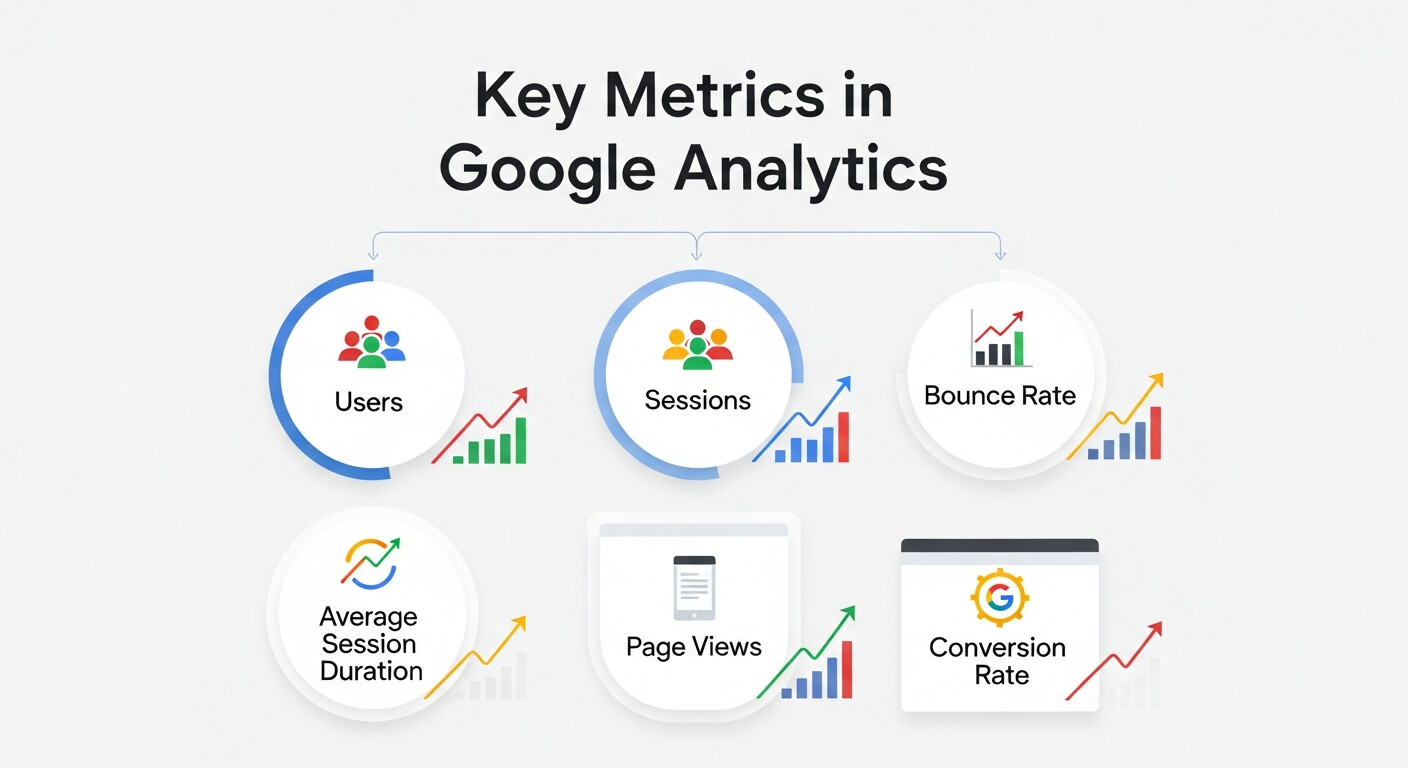
Data is meaningless without context. Here are the core metrics every marketer should know and how to interpret them.
-
Sessions
A “session” represents one visit to your site. Even if a user browses multiple pages, it counts as one session until they leave or remain inactive for 30 minutes.
Why it’s important: Tracking sessions helps you measure website engagement over time. -
Bounce Rate
This measures the percentage of visitors who leave after viewing just one page.
Pro Tip: A high bounce rate signals poor content or irrelevant traffic. Consider improving your landing pages or refining your targeting. -
Traffic Sources
This tells you where your visitors are coming from, categorized as Organic Search, Direct, Referral, or Paid.
Why it’s important: Understanding the channels that drive traffic helps focus your marketing investments. -
Conversion Rate
This metric measures how often users complete a desired action, like purchasing a product or signing up for a webinar.
Key Tip: Define specific goals to track your conversion rates effectively.
Using Google Analytics for SEO
SEO and Google Analytics go hand-in-hand. Here’s how this tool can refine your SEO efforts.
-
Identify High-Performing Pages
Go to “Behavior” > “Site Content” > “All Pages” to see which pages attract the most organic visitors. Focus on these pages to improve rankings further by adding relevant keywords or updating content. -
Search Queries with Google Search Console
By connecting Google Analytics with Search Console, you’ll uncover which search terms bring users to your site. Analyze terms with high impressions but low click-through rates (CTR), and optimize titles or meta descriptions accordingly. -
Track User Acquisition
Under the “Acquisition” tab, break down traffic sources to identify where organic traffic originates. Use this to refine keyword strategies and link-building campaigns.
Setting Up E-Commerce Tracking
![]()
E-commerce tracking in Google Analytics allows marketers to monitor product performance, revenue, and shopping behavior. By enabling Enhanced E-commerce, you can track user actions such as product views, add-to-cart events, and completed transactions. Integrating with platforms like Shopify, WooCommerce, or Magento requires adding tracking code or using plugins to capture detailed metrics automatically. These insights reveal which products are performing best, which pages drive purchases, and at which stage users abandon carts. With this data, marketers can optimize product listings, pricing strategies, and promotional campaigns to boost revenue. Proper setup ensures accurate reporting, giving a complete view of customer journeys from product discovery to checkout.
Setting Up Event Tracking
Event tracking lets you monitor specific user interactions that don’t automatically generate pageviews. Actions like button clicks, video plays, downloads, and form submissions can all be tracked as events. In Google Analytics, these events are categorized by event category, action, and label, allowing granular analysis of user behavior. Implementing events can be done manually with JavaScript or via Google Tag Manager, which simplifies the process. Event tracking helps marketers understand engagement beyond page visits, such as which features users interact with most or which calls-to-action are effective. This data is essential for improving site design, content placement, and conversion strategies. Accurate event tracking drives smarter, data-driven marketing decisions.
Analyzing Audience Demographics
Google Analytics provides insights into the demographics of your website visitors, including age, gender, location, and interests. These insights allow marketers to tailor content, products, and campaigns to specific segments. For instance, knowing your primary audience is aged 25–34 can guide tone, visuals, and platform targeting for ads. Geographic insights help optimize regional campaigns or shipping strategies, while interest data can fuel personalized marketing or content recommendations. By analyzing demographic patterns, marketers can also detect emerging audience segments and adapt messaging accordingly. When combined with behavior metrics, demographic analysis helps businesses create highly targeted marketing strategies, ensuring campaigns reach the right people at the right time for maximum engagement and conversions.
Custom Reporting and Dashboards
Google Analytics allows marketers to build custom reports and dashboards to track the metrics that matter most. Instead of sifting through default reports, you can combine multiple metrics, segments, and filters into a single view. Custom dashboards can track traffic sources, top-performing pages, campaign ROI, or conversion rates in real-time. Marketers can also schedule automated email reports, making it easy to share insights with teams or stakeholders. This approach ensures data-driven decisions are quick and efficient. Custom reports help identify trends, monitor KPIs, and detect performance issues early. They transform raw analytics into actionable intelligence, giving marketers a clear picture of how campaigns, content, and user behavior impact overall business objectives.
Real-Time Analytics for Marketing

Real-time analytics in Google Analytics provides instant data on visitors currently active on your website. You can monitor traffic sources, pages being viewed, user locations, and even ongoing conversions. This feature is invaluable during campaigns, product launches, or live events, as marketers can immediately assess the impact of social media posts, email blasts, or paid ads. Real-time insights allow quick adjustments, such as modifying ad targeting, updating landing pages, or addressing technical issues. By reacting instantly, marketers can optimize campaigns on the fly, improving engagement and conversion rates. Real-time data bridges the gap between strategy and execution, turning insights into immediate action for measurable marketing success.
Funnel Visualization for Conversions
Funnel visualization allows marketers to map the steps users take toward a goal, such as making a purchase or signing up for a newsletter. In Google Analytics, funnels show where users drop off in the conversion process, highlighting obstacles in the path to completing a goal. For example, if many users abandon checkout after adding items to the cart, marketers can investigate issues like complicated forms, slow loading pages, or unclear CTAs. Funnel analysis is crucial for optimizing conversion rates, reducing drop-offs, and improving user experience. By regularly reviewing funnel data, marketers can implement targeted interventions and A/B tests to ensure more users complete desired actions, increasing revenue and engagement.
Integrating Google Analytics with Marketing Automation
Integrating Google Analytics with marketing automation platforms, such as HubSpot, Marketo, or Mailchimp, allows marketers to connect website behavior with lead nurturing campaigns. This integration tracks user interactions across email campaigns, landing pages, and forms, providing a complete view of engagement. Marketers can trigger personalized workflows based on actions, like sending follow-up emails to users who download a resource or abandoned carts. The combined insights improve segmentation, targeting, and ROI measurement for campaigns. By linking automation with Google Analytics data, marketers can make informed decisions on content strategy, campaign timing, and audience targeting, creating highly personalized and effective marketing campaigns that drive conversions and long-term engagement.
Tracking Multi-Channel Campaigns
Modern marketing relies on multiple channels, including organic search, paid ads, social media, email, and referrals. Google Analytics enables marketers to track performance across all these channels in one dashboard. Using UTM parameters, each campaign can be tagged to identify traffic source, medium, and specific campaigns accurately. Channel grouping and attribution models show which touchpoints contribute most to conversions, helping marketers allocate budget and optimize campaigns effectively. Multi-channel tracking uncovers the customer journey, showing how users interact with different channels before converting. This holistic view empowers marketers to refine strategies, prioritize high-performing channels, and improve overall marketing ROI by making data-driven decisions across all digital touchpoints.
Attribution Models in Google Analytics for Smarter Marketing Decisions
Understanding which marketing channels truly drive conversions is essential for smarter budget allocation and long-term campaign success. Google Analytics attribution models help marketers assign conversion credit across multiple touchpoints instead of relying solely on last-click data. This provides a clearer and more accurate view of the complete customer journey.
By analyzing attribution data, marketers can identify high-impact channels, uncover hidden contributors, and make informed decisions that improve ROI and campaign efficiency.
Key Benefits of Attribution Modeling
- Understand the full customer journey, not just the final interaction
- Identify supporting channels that influence conversions
- Optimize budget allocation across paid, organic, and referral channels
- Reduce wasted ad spend by focusing on high-contribution touchpoints
- Improve marketing ROI with data-backed decisions
Common Attribution Models in Google Analytics
| Attribution Model | How It Works | Best Use Case |
|---|---|---|
| Last Click | Assigns all credit to the final interaction | Simple reporting and quick insights |
| First Click | Credits the first user interaction | Measuring brand awareness impact |
| Linear | Distributes credit equally across all touchpoints | Balanced journey analysis |
| Time Decay | Gives more credit to recent interactions | Short sales cycles |
| Data-Driven | Uses machine learning to assign credit | Advanced, conversion-focused marketing |
Analyzing User Behavior and Experience
Understanding what users do on your site can uncover major opportunities for improvement.
-
User Flow Reports
Find this under Behavior > User Flow. It visualizes users’ paths through your website, showing where they drop off or stick around.
Actionable Insight: If drop-offs happen on a specific page, optimize that page’s content, design, or CTAs. -
Device Performance
Analyze the “Audience > Mobile > Overview” report to see how users interact with your site across desktop, tablet, and mobile.
Tip: If mobile users bounce at higher rates, prioritize a mobile-responsive design.
Measuring the Performance of Marketing Campaigns
Every marketing campaign, from email to Facebook ads, can (and should) be measured with Google Analytics.
-
UTM Tracking
Add UTM parameters to your campaign URLs to track their performance within Google Analytics. For instance, you’ll know how your latest newsletter drove traffic compared to a Facebook ad. -
Campaign Reports
Under “Acquisition” > “Campaigns,” view how specific campaigns perform regarding traffic, bounce rates, and conversions.
Pro Tip: Use this data to refine poorly performing campaigns in real-time.
Measuring Marketing ROI with Google Analytics Metrics
Tracking performance is important—but understanding return on investment (ROI) is what truly defines marketing success. Google Analytics allows marketers to connect traffic, engagement, and conversions directly to revenue, helping evaluate which campaigns deliver real business value.
By focusing on ROI-driven metrics, marketers can justify budgets, optimize campaigns, and align analytics insights with business goals.
Key ROI-Focused Metrics Every Marketer Should Track
- Conversion Rate (CR) to measure campaign effectiveness
- Customer Acquisition Cost (CAC) to evaluate spend efficiency
- Revenue per Session to assess traffic quality
- Goal Completion Value to quantify non-purchase actions
- Return on Ad Spend (ROAS) for paid campaign analysis
Important Google Analytics Metrics for ROI Analysis
| Metric | What It Measures | Why It Matters |
|---|---|---|
| Conversion Rate | Percentage of users completing a goal | Shows campaign effectiveness |
| Customer Acquisition Cost | Cost to acquire one customer | Controls marketing spend |
| Revenue per Session | Average revenue per visit | Evaluates traffic quality |
| Goal Value | Monetary value of key actions | Measures non-sales ROI |
| ROAS | Revenue generated from ads | Optimizes paid campaigns |
Advanced Google Analytics Techniques for Marketing
To stay ahead, take your analytics game a step further with these advanced techniques.
-
Custom Dashboards
Create custom dashboards to visualize the metrics most relevant to your marketing goals. For example, track ad spend alongside conversions for a detailed ROI view. -
Cohort Analysis
Find this under “Audience > Cohort Analysis.” It groups users based on shared characteristics (such as acquisition date) to identify retention trends.
Why it’s Beneficial: Discover which marketing activities lead to high long-term customer retention. -
Behavioral Segmentation
Segment users into groups, such as first-time visitors or returning customers, under the “Audience” tab.
Pro Insight: Target remarketing campaigns specifically to users who’ve abandoned carts or browsed your services.
Why Google Analytics Is a Game-Changer for Marketing
Google Analytics isn’t just a dashboard of numbers. It’s a powerhouse that equips marketers with actionable insights for smarter decision-making. With the ability to monitor campaign performance, boost SEO, and understand user behavior, it transforms how businesses approach marketing.
The next step? Start experimenting with Google Analytics today. By committing to this tool, you’ll put your marketing strategies miles ahead of the competition.
Want to become even more data-savvy? Visit Google’s Analytics Academy for free programs and tutorials.
Frequently Asked Questions (FAQ)
1. What is Google Analytics used for in marketing?
Google Analytics helps marketers track website traffic, user behavior, and conversions. It shows which campaigns, channels, or content drive engagement, allowing data-driven decisions to improve SEO, advertising ROI, and overall marketing performance.
2. Is Google Analytics free for marketers?
Yes, the standard version of Google Analytics is free and sufficient for most businesses. Google Analytics 360 is a paid enterprise version offering advanced reporting, higher data limits, and dedicated support.
3. How do I track marketing campaign performance?
Use UTM parameters in your campaign URLs and check the “Acquisition > Campaigns” report. This tracks traffic, conversions, and engagement for email campaigns, social ads, or paid search efforts.
4. How long does it take for data to appear in Google Analytics?
Data usually shows up within minutes, but some reports can take a few hours. Real-time reports allow immediate verification of traffic and campaign performance.
5. What are the key metrics marketers should track?
Important metrics include sessions, bounce rate, traffic sources, conversion rate, and engagement metrics like average session duration. These help measure website performance and campaign success.
6. Can I track multiple websites in one Google Analytics account?
Yes, you can create multiple properties under a single account to monitor multiple websites or apps separately while managing them from one dashboard.
7. How can I improve conversion tracking?
Set up specific goals in Google Analytics, track events like form submissions or button clicks, and integrate with other tools such as Google Ads or CRMs to monitor conversions accurately.
8. Is Google Analytics GDPR compliant?
Google Analytics offers features like IP anonymization and consent mode to help comply with GDPR. However, it is your responsibility to configure the tool correctly and obtain visitor consent.
9. What is the difference between GA4 and Universal Analytics?
GA4 focuses on event-based tracking, cross-device measurement, and privacy controls, while Universal Analytics (no longer supported for new tracking) used session-based tracking. GA4 is the recommended platform for marketing analysis today.
10. How can I learn to use Google Analytics effectively?
Google Analytics Academy offers free tutorials and courses for marketers to learn everything from basic tracking to advanced reporting and analysis techniques.