Marketing is not only about creativity or gut instinct anymore. For example, organizations are leveraging data, which is revolutionizing strategy development, performance measurement and challenges. Data is one of the most valuable commodities on Earth but can also be deceptively overwhelming. Raw datasets, numbers and figures aren’t exactly easy to interpret or act on. This is where marketing analytics data visualization comes into play.
Data visualization allows users to view these complicated datasets as engaging graphs, charts, and dashboards. It enables marketers, analysts, and decision makers to discover trends, follow metrics, and provide actionable insights. So if you’ve been wanting to know how to take your approach to marketing analytics to a new level — this post is for you.
Here’s what we’ll cover:
- Principles of effective data visualization
- Tools to supercharge your marketing analytics
- Real-world examples of successful campaigns
- Best practices, pitfalls to avoid, and future trends
By the end of this blog, you’ll feel empowered to convert overwhelming numbers into clear, impactful visuals that drive decisions.
Data Visualization for Cross-Channel Marketing Performance
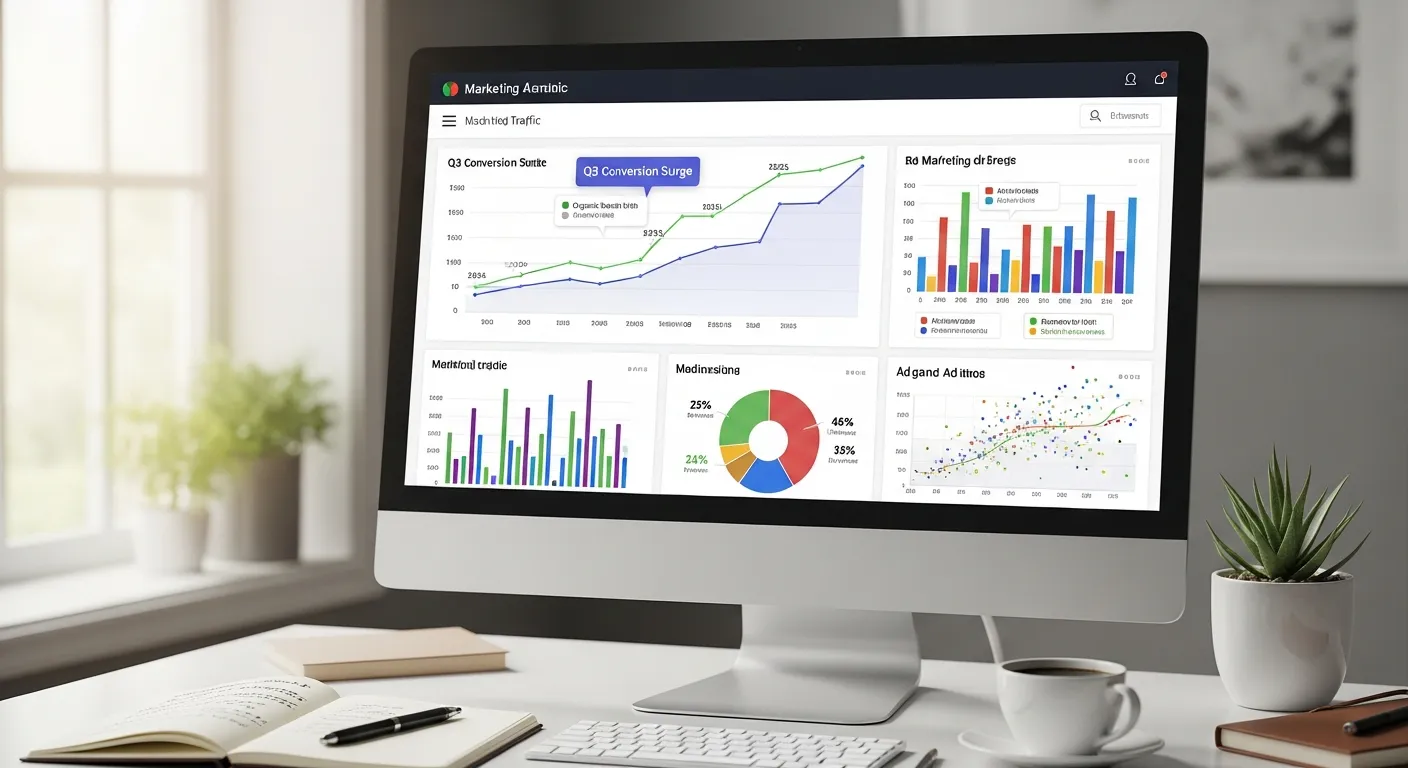
Modern marketing rarely depends on a single channel. Brands operate across social media, search engines, email campaigns, paid ads, and websites simultaneously. Data visualization in marketing analytics helps unify these fragmented data sources into a single, coherent view. By visualizing cross-channel performance, marketers can easily compare which platforms drive the highest engagement, conversions, and return on investment. Interactive dashboards reveal how channels influence one another, such as how social media traffic supports email conversions or paid ads boost organic search interest. This clarity allows teams to identify underperforming channels, eliminate inefficiencies, and optimize campaigns holistically rather than in isolation. As a result, cross-channel visualization supports smarter allocation of budgets and more consistent customer experiences.
Why Data Visualization Matters in Marketing Analytics
Marketing analysts deal with massive amounts of data daily, from customer demographic details to campaign performance metrics and website traffic stats. However, raw data alone offers little value unless it can be communicated clearly to stakeholders. This is why visual representation matters:
Benefits of Data Visualization in Marketing:
- Simplifies Complexity
Clear visuals make it easier to understand intricate trends such as ROIs across multiple regions or the customer’s purchase funnel.
- Enhances Storytelling
A well-crafted visualization connects the dots and turns numbers into a compelling narrative. For instance, a declining line graph accompanying a “before vs. after” campaign comparison tells a much more relatable story.
- Accelerates Decision-Making
Marketing decisions often have tight deadlines. Dashboards and charts that offer real-time insights help teams respond faster to challenges.
- Improves Stakeholder Communication
Charts and visuals make meetings smoother. Suddenly, marketing performance isn’t just raw spreadsheets; it’s a cohesive story that resonates with executives of all backgrounds.
<!– Make sure these benefits link back to our topic to keep it relevant for marketers or strategists reading this blog. –>
How Data Visualization Supports Smarter Marketing Strategy
Data visualization in marketing analytics plays a critical role in shaping smarter, more agile marketing strategies. Instead of relying on static reports or intuition, marketers can visually assess performance across channels, audiences, and timeframes. This clarity allows teams to identify what’s working, what’s underperforming, and where resources should be reallocated for maximum impact.
By turning analytics into visual insights, marketing leaders can align campaigns more closely with business objectives and respond quickly to market changes. Visual data also improves collaboration, as teams across departments can easily interpret insights without needing deep technical expertise.
Key strategic advantages of marketing data visualization include:
- Improved campaign optimization through clear performance comparisons
- Faster identification of customer behavior trends and intent signals
- Better budget allocation across channels and regions
- Stronger alignment between marketing goals and business outcomes
How visualization impacts marketing strategy
| Marketing Area | Without Visualization | With Data Visualization in Marketing Analytics |
|---|---|---|
| Campaign Performance | Hard-to-read spreadsheets | Clear dashboards showing ROI and trends |
| Audience Insights | Fragmented demographic data | Visual customer segments and behavior flows |
| Budget Allocation | Reactive decision-making | Data-backed, proactive optimization |
| Strategic Planning | Guesswork-based | Insight-driven and measurable |
Data Visualization for Cross-Channel Marketing Performance

Modern marketing rarely depends on a single channel. Brands operate across social media, search engines, email campaigns, paid ads, and websites simultaneously. Data visualization in marketing analytics helps unify these fragmented data sources into a single, coherent view. By visualizing cross-channel performance, marketers can easily compare which platforms drive the highest engagement, conversions, and return on investment. Interactive dashboards reveal how channels influence one another, such as how social media traffic supports email conversions or paid ads boost organic search interest. This clarity allows teams to identify underperforming channels, eliminate inefficiencies, and optimize campaigns holistically rather than in isolation. As a result, cross-channel visualization supports smarter allocation of budgets and more consistent customer experiences.
Improving Customer Segmentation with Visual Analytics
Understanding audiences is at the heart of successful marketing. Data visualization in marketing analytics enables marketers to break down complex customer data into clear, actionable segments. Visual tools such as cohort charts, heat maps, and behavior flow diagrams help teams identify patterns based on demographics, interests, purchase history, and engagement levels. Instead of static tables, visual analytics shows how different customer groups interact with content and progress through the funnel. This insight allows marketers to personalize messaging, refine targeting strategies, and design campaigns that resonate with specific audience segments. Over time, visual customer segmentation leads to improved engagement rates, stronger brand loyalty, and higher lifetime customer value.
Using Data Visualization to Measure Marketing ROI
Measuring marketing ROI can be challenging when performance data is scattered across platforms. Data visualization in marketing analytics simplifies ROI measurement by presenting financial and performance metrics side by side. Dashboards that visualize cost per acquisition, return on ad spend, and conversion value allow marketers to instantly assess campaign profitability. Trend charts highlight performance changes over time, while comparison visuals reveal which campaigns deliver the strongest returns. This transparency helps decision-makers justify marketing spend and adjust strategies before budgets are wasted. By turning ROI data into clear visuals, organizations move from reactive reporting to proactive, performance-driven marketing optimization.
Enhancing Team Collaboration Through Visual Dashboards
Marketing success often depends on collaboration between analysts, creatives, managers, and executives. Data visualization in marketing analytics bridges communication gaps by presenting insights in a format everyone can understand. Visual dashboards replace dense spreadsheets with intuitive charts that highlight key takeaways at a glance. This shared visual language ensures teams align on goals, performance, and next steps. During meetings, dashboards help stakeholders focus on insights rather than debating numbers. As a result, teams make faster decisions, reduce misunderstandings, and maintain consistent strategic direction. Visual collaboration ultimately strengthens accountability and improves overall marketing execution.
Preparing Marketing Teams for a Data-Driven Future
As marketing becomes increasingly data-centric, the ability to interpret and visualize data is no longer optional. Data visualization in marketing analytics equips teams to adapt to evolving technologies, AI-driven tools, and advanced analytics platforms. Marketers who embrace visual analytics gain a competitive advantage by spotting trends early and responding to market changes with confidence. Future-ready teams invest in visualization skills, scalable tools, and data literacy across roles. This preparation ensures marketing strategies remain agile, measurable, and aligned with business growth. In a rapidly changing digital landscape, visualization is the foundation of sustainable, data-driven marketing success.
Key Principles for Effective Data Visualization
Not all visualizations are created equal. Misused charts and cluttered graphics can confuse rather than clarify. To ensure your visualizations truly work, follow these principles:
1. Clarity Over Complexity
Keeping visuals simple and clear is vital. For instance:
- Use bar graphs for comparisons.
- Pie charts should be reserved for data that segments into percentages (and no more than 5 slices).
- Avoid overloading the viewer with excessive data points on a single graph.
2. Relevance
Every element in your visualization should focus on answering a business question. Before presenting a chart, ask yourself:
- Does this directly convey marketing performance?
- Will stakeholders understand how this aligns with our goals?
3. Aesthetics and Accessibility
Balanced, clean design enhances engagement. Stick to consistent colors, readable fonts, and a hierarchy (e.g., larger fonts for key metrics). Red-green colorblind-friendly palettes should also be considered. Tools like ColorBrewer can help.
4. Choosing the Right Visualization Type
Match your dataset with the correct visualization type:
- Bar Graphs for categorical data comparisons
- Line Graphs to track changes over time (e.g., monthly organic traffic growth)
- Scatter Plots for relationships (e.g., ad budget vs. leads)
- Heat Maps for granular regional insights
Popular Data Visualization Tools for Marketing Analysts
The right tools make all the difference. Here are some leading platforms you should try:
1. Power BI
Benefits:
- Intuitive dashboard creation.
- Built-in AI tools to automate insights.
- Seamless integration with Microsoft products.
2. Tableau
Known for its interactive reports, Tableau excels at handling layered datasets.
Use case:
- A marketing strategist visualizing ROI figures segmented by campaign type and channel.
3. Google Data Studio
Ideal for marketers who rely heavily on Google Analytics. What’s more, it’s free, making it perfect for small businesses and startups.
4. Zoho Analytics
With built-in marketing templates, Zoho automatically recognizes common KPIs such as impressions or clicks, cutting down setup time.
5. Chartio (Snowflake)
This powerful end-to-end data visualization tool is loved for its scalability, ensuring it works for small campaigns as well as multinational ad accounts.
Aligning Data Visualization with the Marketing Funnel
To maximize impact, data visualization in marketing analytics should be aligned with each stage of the marketing funnel. Different stages require different metrics, and visualizing them correctly ensures marketers focus on the right insights at the right time. Funnel-based visualization helps teams understand how prospects move from awareness to conversion and where drop-offs occur.
When funnel metrics are visualized effectively, marketers can refine messaging, improve targeting, and enhance customer experience across touchpoints. This approach supports data-driven brand marketing by ensuring every decision is backed by clear, visual evidence.
Key funnel stages supported by data visualization:
- Awareness stage analysis using traffic, reach, and impressions
- Consideration stage tracking engagement, CTRs, and time on site
- Conversion stage monitoring leads, sales, and cost per acquisition
- Retention stage measuring repeat purchases and customer lifetime value
Marketing funnel metrics and visualization focus
| Funnel Stage | Key Metrics | Best Visualization Type |
|---|---|---|
| Awareness | Impressions, reach, sessions | Line charts and bar graphs |
| Consideration | Engagement rate, CTR, bounce rate | Funnel charts and heat maps |
| Conversion | Leads, sales, ROAS | Conversion funnels and KPI cards |
| Retention | CLV, repeat purchases | Trend lines and cohort charts |
Real World Case Studies of Data Visualization Success
Case Study 1:
Brand: A fashion eCommerce store
Problem: Social ad spending wasn’t translating to sales.
Solution:
Using heat maps, their marketing team identified which cities had high reach but poor CTRs. They reallocated budget to stronger-performing areas and coupled this with retargeting ads. The result? A 37% increase in conversions within two months.
Case Study 2:
Brand: A SaaS company
Problem: Poor email campaign ROIs.
Solution:
The company used time-series visualizations to identify peak email open rates by hour. By scheduling emails during optimal hours, their average open rate improved by 18%.
Best Practices for Building Marketing Dashboards
Dashboards can often be cluttered or overdesigned. Follow these practices for impactful results:
- Prioritize KPIs: Only include metrics that truly matter to your goals, such as ROAS, CLV, or bounce rates.
- Optimize for Real-Time Data: Tools such as Google Analytics 4 enable live reporting on website figures.
- Be Selective with Filters: For instance, if presenting to the finance team, prioritize budget-related metrics over audience segmentation.
Common Mistakes to Avoid in Visualization
-
Overloading Charts
Using 10+ data points on a line graph may overwhelm your team.
-
Ignoring Mobile Access
Modern analysts check dashboards on mobile devices, so avoid designs reliant on large, interactive elements.
-
Misusing Axes
Manipulating axes can make a spike seem more dramatic than it is. Be honest and keep proportions intact.
Emerging Trends in Data Visualization for Marketing
- AI-Powered Insights
AI tools like Tableau GPT are quickly automating manual data extractions, enabling quicker decision-making.
- Augmented Reality Dashboards
Visualizing marketing campaigns in AR will blend physical spaces and marketing metrics, providing even more dynamic insights.
- Storytelling with Animated Visuals
Short animations are expected to trend in 2024, merging storytelling and readable charts.
Driving Better Decisions Through Better Visuals
Marketing is part art and part science, with data bridging the gap. Effective data visualizations allow organizations to see patterns, identify gaps, and craft strategies that truly work.
Are you ready to take your marketing analytics to the next level? At AnalyzeNest, our tools and resources help professionals like you turn raw data into actionable insights. Visit our platform and sign up to start building smarter dashboards today.
Transform numbers into insights. The future of marketing is visual.
Frequently Asked Questions (FAQs)
1. What is data visualization in marketing analytics?
Data visualization in marketing analytics is the process of turning raw marketing data into visual formats such as charts, graphs, and dashboards. These visuals help marketers understand performance, identify trends, and extract actionable insights quickly.
2. Why is data visualization important in marketing analytics?
Data visualization is important because marketing data can be complex and overwhelming. Visual representations simplify information, improve communication with stakeholders, and support faster, more accurate decision-making.
3. How does data visualization help drive results with data?
Data visualization helps drive results with data by making patterns, gaps, and opportunities visible. When marketers can clearly see performance trends, they can optimize campaigns, allocate budgets wisely, and improve overall marketing effectiveness.
4. Can Google Analytics be used for data visualization in marketing?
Yes, Google Analytics can be used effectively for data visualization in marketing. By mastering Google Analytics, marketers can visualize traffic sources, user behavior, conversions, and campaign performance through built-in reports or connected dashboards.
5. How to use Google Analytics for marketing analytics?
To use Google Analytics for marketing analytics, marketers should track relevant KPIs, analyze user journeys, and visualize performance data using dashboards. This approach helps transform raw metrics into insights that support data-driven marketing decisions.
6. What tools are best for data visualization in marketing analytics?
Several tools support data visualization in marketing analytics, including Tableau, Power BI, Google Data Studio, and Zoho Analytics. These platforms allow marketers to perform analytics advanced data analysis and present insights in interactive formats.
7. How does advanced data analysis improve marketing visualizations?
Advanced data analysis improves marketing visualizations by uncovering deeper insights such as predictive trends, attribution patterns, and audience segmentation. These insights make visual dashboards more strategic and decision-focused.
8. How does analytics support data-driven brand marketing?
Analytics supports data-driven brand marketing by showing how audiences engage with content, campaigns, and channels. Visual insights help brands refine messaging, improve targeting, and align marketing strategies with measurable outcomes.
9. What are common mistakes in marketing data visualization?
Common mistakes include overcrowded visuals, misleading axes, inconsistent design, and ignoring mobile accessibility. These issues can confuse stakeholders and reduce the effectiveness of marketing insights.
10. Is data visualization essential for modern marketing success?
Yes, data visualization is essential for modern marketing success because it bridges the gap between data and strategy. Clear visuals empower marketers to make informed decisions, improve performance, and stay competitive in a data-driven landscape.