Content marketing isn’t just about producing good content anymore; it is about leveraging Content Marketing Analytics to ensure every creative asset delivers a measurable, profitable consequence for your business.
This comprehensive guide explores how Content Marketing Analytics bridges the gap between creative intuition and data-proven results. We delve into establishing high-impact KPIs, utilizing advanced tools like Google Analytics and SEMrush, and applying AI-driven trends to optimize your content strategy for maximum audience engagement and ROI.
What Are Content Marketing Analytics, and What Do They Mean?
At its core, Content Marketing Analytics is the systematic practice of monitoring, measuring, and interpreting the massive amounts of data generated by your content strategy. It isn’t just about looking at a spreadsheet; it is the art of examining the human impact of your digital footprint. When you look at Content Marketing Analytics, you are asking: “How is my audience interacting with my message, and is that interaction moving them closer to a business objective?”
The Evolution from Art to Science
Historically, marketing was seen as a purely creative endeavor—vibrant imagery and catchy slogans. However, in the modern digital landscape, creativity without a measurable consequence is simply expensive noise. Content Marketing Analytics provides the “why” behind the “what.” It acts as the bridge between assumption and proof.
Rather than relying on a gut feeling that your audience prefers long-form whitepapers, analytics provides the evidence. For instance, you might find through Digital Marketing Analytics that while your whitepapers have high downloads, your short-form videos actually drive more Brand Awareness and conversion. This shift allows marketers to manage resources with surgical precision, shifting budgets away from “vanity projects” and toward high-performing assets that enhance Brand Equity in Marketing.
Bridging the Gap Between Assumption and Proof
Assume for a moment that your team spends forty hours a week producing high-quality blog posts. Without Content Marketing Analytics, you are operating on the assumption that these posts drive revenue. Data might reveal a different story: perhaps the blog drives traffic, but your Customer Journey Analytics show that visitors leave without clicking a single Call to Action (CTA).
By analyzing Marketing Analytics Data, you can identify these gaps. You might discover that a specific demographic—perhaps those interested in Luxury Brand Marketing—prefers a different Brand Voice Strategy than what you are currently providing. This insight allows you to repackage underperforming content, adjust your Brand Positioning, and ultimately secure a better return on your creative investment.
Establishing Content Marketing Goals and KPIs
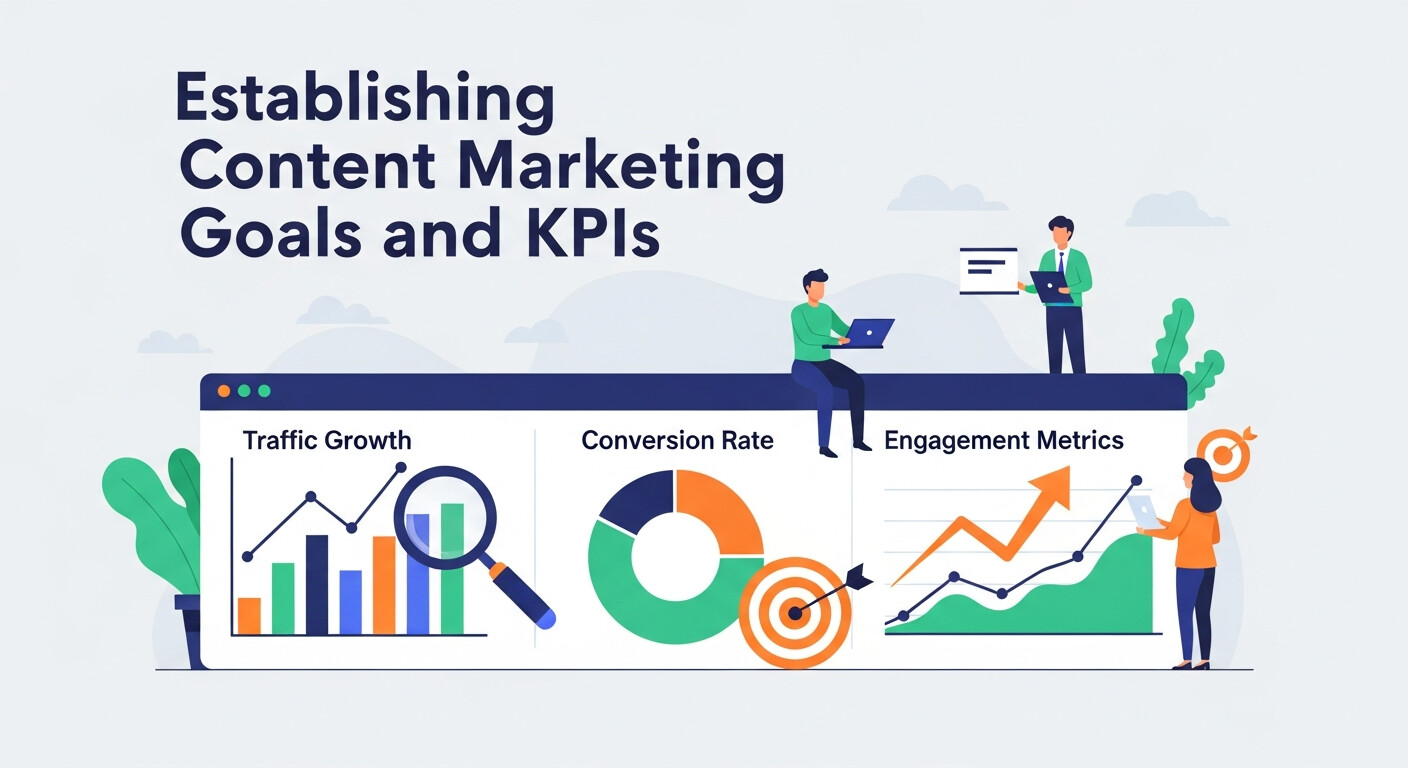
Before you can track success, you must establish what success looks like for your specific organization. Content Marketing Analytics is heavily rooted in goal-setting; without a destination, the data is just a collection of random numbers.
Step 1: Set Strategic Objectives
What is the primary “north star” for your content? Most businesses focus on a few core pillars:
- Brand Awareness: Increasing the total number of people who know your brand exists.
- Lead Generation: Capturing contact details from potential customers, often through gated content.
- Sales and Conversions: Direct revenue generated from content-led interactions.
- Customer Retention: Using content to reduce churn and increase Customer Lifetime Value (CLV).
Step 2: Identify High-Impact KPIs
Once objectives are set, you need Key Performance Indicators (KPIs) to track progress. If you are focused on B2B Digital Marketing Strategies, your KPIs will look very different from a viral TikTok campaign.
| Business Goal | Strategic KPI | Supporting Metrics |
| Increase Reach | Total Impressions | New Visitors, Social Reach, Mentions |
| Drive Engagement | Engagement Rate | Average Time on Page, Comments, Shares |
| Lead Generation | Conversion Rate | Form Submissions, Gated Content Downloads |
| SEO Authority | Organic Traffic | Domain Authority, Keyword Rankings |
| Brand Loyalty | Repeat Visitor Rate | Email Open Rates, Subscription Growth |
For example, if you are running an Event Marketing Analytics program for a webinar, your primary KPI isn’t just “who showed up,” but the “Webinar Sales Funnel” efficiency—how many attendees transitioned into the sales pipeline. This level of granularity is what separates a novice from a Digital Marketing Expert.
Key Metrics to Keep Track
To truly master Content Marketing Analytics, you must categorize your data. Looking at a single number is dangerous; looking at a cluster of related metrics provides a narrative.
1. Engagement Metrics: The Depth of Connection
Engagement metrics tell you if your content is actually resonating or if people are just clicking and leaving.
-
Average Time on Page: If a 2,000-word article has an average time on page of 10 seconds, your Brand Storytelling isn’t working.
-
Bounce Rate: A high bounce rate (over 70%) often suggests a disconnect between your SEO title and the actual content. It might also indicate a lack of Building Brand Consistency.
-
Scroll Depth: This is a vital Advanced Web Analytics metric. It shows where people lose interest, allowing you to optimize your CTA placement.
2. Reach Metrics: The Breadth of Influence
Reach metrics quantify your “Digital Footprint.”
- Unique Visitors: How many distinct individuals are seeing your content?
- Traffic Sources: Are they coming from Referral Marketing, organic search, or SMS Marketing?
- Social Impressions: Essential for measuring Brand Awareness on platforms like LinkedIn or Instagram.
3. Conversion Metrics: The Bottom Line
Ultimately, content must pay for itself.
- Click-Through Rate (CTR): The percentage of people who clicked your link out of the total who saw it.
- Cost Per Acquisition (CPA): How much you spent on content to acquire one customer.
- Attribution Modeling: Determining which piece of content gets the “credit” for the sale. This is a core part of Partnership Marketing with Video Analytics.
The Essential Toolkit for Content Marketing Analytics
The right tools act as your eyes and ears in the digital world. Without them, you are flying blind.
The Power Players
- Google Analytics 4 (GA4): The undisputed king. GA4 is essential for tracking Mobile App Marketing Analytics and website behavior. The “Path Exploration” tool is particularly useful for Customer Journey Mapping. Google Analytics
- SEMrush: While known for Measuring SEO Success, SEMrush is a powerhouse for Competitive Brand Analysis. It allows you to see which keywords your competitors are ranking for and how their content performs. SEMrush
- BuzzSumo: This tool is the gold standard for Viral Content Marketing Strategy. It tracks social shares and helps you identify Trending Webinar Topics by showing what content is currently being shared the most in your industry.
Specialized Tools
- HubSpot: An all-in-one platform that links content directly to revenue. It is excellent for B2B Digital Marketing Strategies and tracking Inbound Marketing performance.
- Tableau / Power BI: For those handling Chemical Market Analytics or complex enterprise data, these visualization tools help turn raw numbers into beautiful, understandable dashboards.
- Adobe Analytics: A high-end tool for Luxury Brand Marketing teams who need real-time data and sophisticated audience segmentation.
For the Data Processing and Interpretation

Data without interpretation is just noise. To get the most out of Content Marketing Analytics, you must become a “Data Storyteller.”
Finding Trends and Patterns
Don’t just look at today’s numbers. Look for seasonality. For example, a Fashion Marketing Strategy might see a spike in content engagement every Thursday evening. By identifying these patterns, you can optimize your “Content Publication Schedule” to hit your audience when they are most active.
Segmenting Your Audience
Not all visitors are created equal. Use your analytics to segment users based on behavior.
- New vs. Returning: Are you attracting new blood or nurturing the old?
- Device Type: If 80% of your audience is on mobile, but your Web Design & Development is optimized for desktop, you are losing money.
- Geographic Data: Crucial for Local SEO Services and Global Brand Adaptation Strategies.
Identifying Underperforming “Zombie” Content
Use tools like Ahrefs or SEMrush to find pages that have “decayed.” These are pages that used to rank well but have lost their position. Revitalizing this content through a Brand Refresh or updated data is often much cheaper than creating new content from scratch. This is a key Marketing Analytics Hack.
Bettering Your Content Strategy through Action
Once you have the insights, you must act. Content Marketing Analytics should drive your creative roadmap.
Double Down on the Winners
If the data shows that your “How-To” videos have a 40% higher conversion rate than your whitepapers, reallocate your budget. This might mean investing more in Mastering Video Analytics or hiring Influencer Marketing Services to amplify your video reach.
The Art of Repurposing
If a blog post goes viral, don’t let the momentum die.
- Turn it into an Infographic.
- Create a Short-form Video for TikTok or Reels.
- Expand it into a Webinar Guide.
- Use the key findings in your Outbound Email Marketing campaigns.
A/B Testing and the Psychology of Content
Use analytics to run experiments. Test different Brand Voice styles—is your audience more responsive to a “Professional” or “Playful” Brand Personality In Marketing? A/B testing your headlines can lead to a “Viral Content Marketing” breakthrough by tapping into the Psychology of Trend Marketing.
Case Studies: Real-World Data Triumphs

Case Study 1: Reducing Churn through Engagement
Company A (a SaaS provider) noticed a high churn rate. By diving into their Content Marketing Analytics, they discovered that users who engaged with their “Advanced Feature” tutorials within the first 30 days were 60% more likely to renew. They shifted their Inbound Marketing strategy to prioritize these tutorials in the onboarding process, resulting in a 23% increase in retention.
Case Study 2: Social Media Pivot
Company B (a retail brand) was spending 70% of its budget on Facebook. However, their Marketing Analytics Data showed that while Facebook had more “likes,” Instagram Stories drove 5x more actual sales. They pivoted their budget to Viral Marketing on TikTok and Instagram, achieving a 15% increase in total conversions within one quarter.
The Future of Content Marketing Analytics
The field of Content Marketing Analytics is evolving rapidly. To stay ahead, you must keep an eye on these emerging trends:
AI-Driven Trend Forecasting
We are moving from reactive analytics to Predictive Trend Marketing. Tools now use AI-Driven Trend Marketing to tell you what your audience will want to read next month based on current global search patterns. This is the “Next Gen Trend Marketing Strategy.”
Voice and Visual Search Metrics
As consumers use smart speakers and visual search tools (like Google Lens), Content Marketing Analytics must adapt. Measuring how your content performs in “Position Zero” and voice snippets will be the next frontier of Measuring SEO Success.
Privacy-First Analytics
With the decline of third-party cookies, Brand Safety in Digital Marketing and ethical data collection are paramount. Marketers will need to rely more on first-party data and Customer Journey Mapping within their own ecosystems rather than tracking users across the web.
Conclusion
Content Marketing Analytics is the ultimate competitive advantage in an increasingly crowded digital world. By transforming raw data into a strategic roadmap, you move beyond “hoping” for success to “ensuring” it. Whether you are focused on Luxury Brand Marketing or B2B Digital Marketing Strategies, the path to growth is paved with data. Start analyzing, stop assuming, and watch your content ROI soar.
Frequently Asked Questions
1. What is the most important metric in Content Marketing Analytics?
It depends on your goal, but Conversion Rate is generally considered the “Gold Standard” because it directly measures how content contributes to business growth.
2. How does Content Marketing Analytics differ from Social Media Analytics?
Social analytics is a subset. While social focuses on engagement (likes/shares), Content Marketing Analytics looks at the entire ecosystem, including blogs, emails, and how those social interactions lead back to your website and sales funnel.
3. Can I do analytics for free?
Yes. Google Analytics and Google Search Console provide world-class data for free. However, for Competitive Brand Analysis, you may eventually need paid tools like SEMrush.
4. How often should I check my analytics?
For high-level trends, once a week. For deep-dives and strategy adjustments, a monthly “Analytics Audit” is recommended.
5. What is “Attribution Modeling”?
It is the process of determining which touchpoint in the Customer Journey Mapping gets the credit for a conversion. Is it the first blog post they read, or the last email they clicked?
6. How do I measure “Brand Awareness”?
Track “Branded Search Volume” (how many people type your name into Google) and “Share of Voice” in social media mentions.
7. Why is my bounce rate so high?
It could be slow page speed, poor mobile optimization, or a “Clickbait” title that doesn’t deliver on its promise. Analytics tools can help you pinpoint the exact cause.
8. What is “Predictive Analytics”?
It uses historical Marketing Analytics Data and AI to predict future outcomes, helping you decide which topics are likely to trend.
9. How do I track the success of a video?
Don’t just look at views. Look at “Watch Time” and “Drop-off Points” to understand if people are actually consuming the message. This is part of Mastering Video Analytics.
10. How can I improve my “Brand Authority” using data?
By consistently producing content that answers the questions your data shows your audience is asking, you position your brand as a helpful, expert resource.